10 Year Equity Income Returns (Part 2)
One Strategy For Better Returns
I would like to teach you a process to improve your odds of achieving returns equal to or better than the funds listed in 10 Year Equity Income Returns (Part 1).
Disclaimer: The information provided in this article is for educational purposes only. I am not a professional investment advisor. Please seek professional advice for you investment goals.
What is A Reasonable Return for Long Term Passive Income?
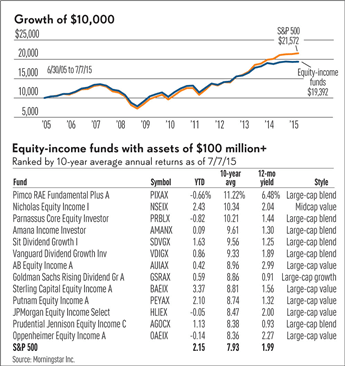
We learned from the table that equity income mutual funds averaged 6.85% a year over a 10 year period (6/30/05 – 7/7/15) while the S&P 500 earned 7.99%. We also noted that earning 7% a year over 10 years will almost double capital invested. This is not a risk free return, nor is it the riskiest option for capital.
Personally, I do not care for mutual funds. One, they can only be bought and sold at the end of the day. Two, they are marked to the market – meaning they are always priced at end of day market prices. They never sell for a premium or a discount.
What is An Alternative Approach to Mutual Funds?
The alternative approach is to invest in closed end funds – funds with a fixed number of shares outstanding, sold on the exchanges, and freely traded during normal trading hours.
The Requirements and Research
I searched for “closed end equity income funds”, a title similar to Morning Star’s table title. Dividend.com provided a table of 87 stocks.
My requirements are as follows:
1. A 10 year track record, minimum.
2. 7% rate of return per year over 10 years (equity doubles).
3. A reasonable annual dividend, 2-3% a year.
4. The NAV or net asset value of the fund can sell at a premium or discount to the market. I am looking for a quality asset at a discounted. This tips the scales in our favor of achieving good returns.
After working through the list, I would like to focus on Boulder Growth & Income Fund, symbol BIF.
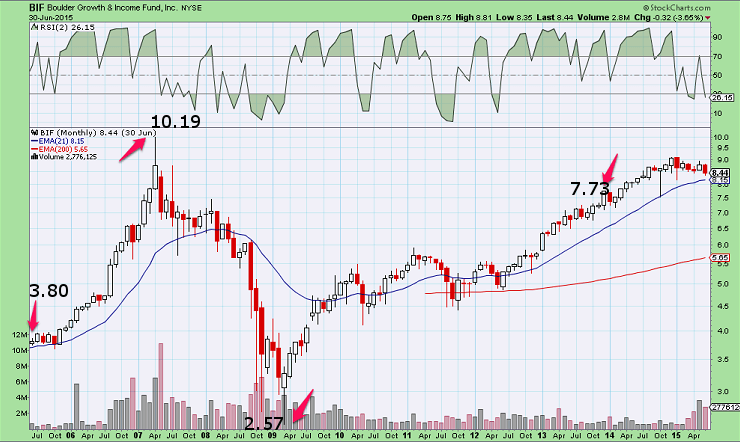
Dividend.com’s table does not provide historical returns, so I used a charting service. Below is a monthly 10 year chart. The opening price on 7/1/05 was 3.80. It is easy to see that the price is double in 04/07; 12/13; and today, it is still above 7.60. It is important to note the 2.57 low in March of 2009 was a 44% contraction of original capital. Last, our numbers do not reflect dividend payouts, so the returns are better over the 10 year period.
[As a side note, I tend to either divide investments in two or three tranches. Once a double occurs, I will take at least one third of the money out of the investment. Other times, I will sell half or take out the original investment. While I don’t mind taking reasonable risks, I also like removing risk as well.]
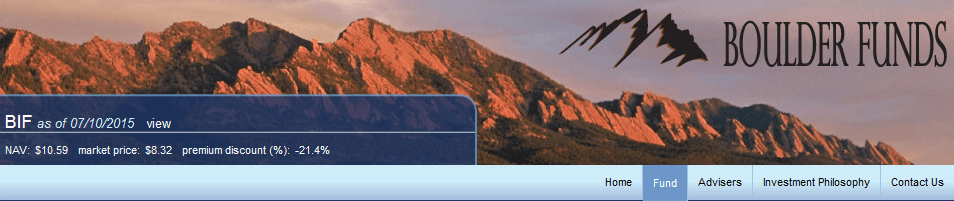
Next, I do a search to locate the NAV of Boulder Growth and Income Fund. The snapshot below shows that this fund is trading at a 21.4% discount to its underlying assets. Which means that this asset is available for 79 cents on the dollar.
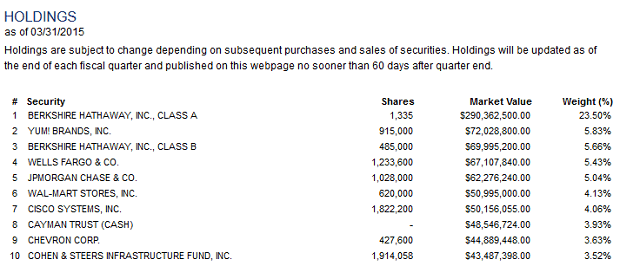
Let’s take a look at one last piece of information before concluding the analysis. The holdings – almost 30% of the assets are in Bershire Hathaway, Warren Buffet’s company. There is a diversification issue here, but I also know that when Warren Buffet invests, he makes great decisions. The balance of the holdings look like great companies. Because the NAV is -21.4%, all of these companies are available at a 21% discount.
Closed end funds can trade at a discount for extended periods of time, but once the value is recognized, the discount quickly disappear.
Investing in discounted assets that spin off cash is one way you can boost your passive income returns.
Sources: